
Forecasting Organic Growth of Chain of Shops and Enabling Stakeholders to Independently Test Scenarios
- Use Case: Growth Forecasting, Scenario Testing, Interactive Dashboards
Summary
Challenge
- Decide how much to invest initially and what % of the generated cash flow to reinvest in order to grow to a certain number of new locations in 24 months.
- Track cash, dividends and valuation over time.
- Visualize the number of shops, cash generated and valuation at the same time under different scenarios.
- Collaboratively create and compare various scenarios and test them independently.
Solution
- Easy-to-use scenario management tool that allows to quickly create and combine scenarios without overwriting assumptions of other stakeholders.
- Automated Scenario Comparison that helps compare multiple scenarios on-the-fly , and Scenario Waterfall Analysis to visualize which drivers change between scenarios and by how much.
- Automated Tornado Analysis to help identify the most impactful input drivers, and Sensitivity Analysis to find out how exactly other drivers affect it.
- Interactive, self-service, spreadsheet-driven dashboards that can be securely shared with stakeholders for them to test scenarios independently in their own isolated ‘sandbox’.
Results
- Modeler has granular control over assumptions and scenarios, and can easily manage stakeholders’ access to the model and dashboards.
- Stakeholders can securely test scenarios through interactive dashboards and find an optimal growth strategy.
- Stakeholders can contribute their own assumptions in the model without overwriting data, provided they are given access to the model.
- Stakeholders can run their own analyses and contribute insights with the help of easy-to-use, automated analytical tools.
Case Study
The owner of a small shop chain wants to grow their business and fund the expansion by partially reinvesting the cash flow generated by the existing shops to open new locations.
The stakeholders want to understand what % of the generated cash flow to reinvest in order to open more shops within 24 months. Additionally, the stakeholders want a responsive visualization of the model that would allow them to play with the numbers and see how different scenarios affect the number of opened shops at the end of the period.
The model demonstrated in this case study takes the following assumptions as inputs:
- The initial investment to open a shop
- The cash flow generated from each location
- The amount stakeholders want to reinvest
With Visyond, in the short video below, we will visualize the number of shops that can be opened over time, create and compare different scenarios, and build an interactive dashboard for stakeholders to test scenarios independently.
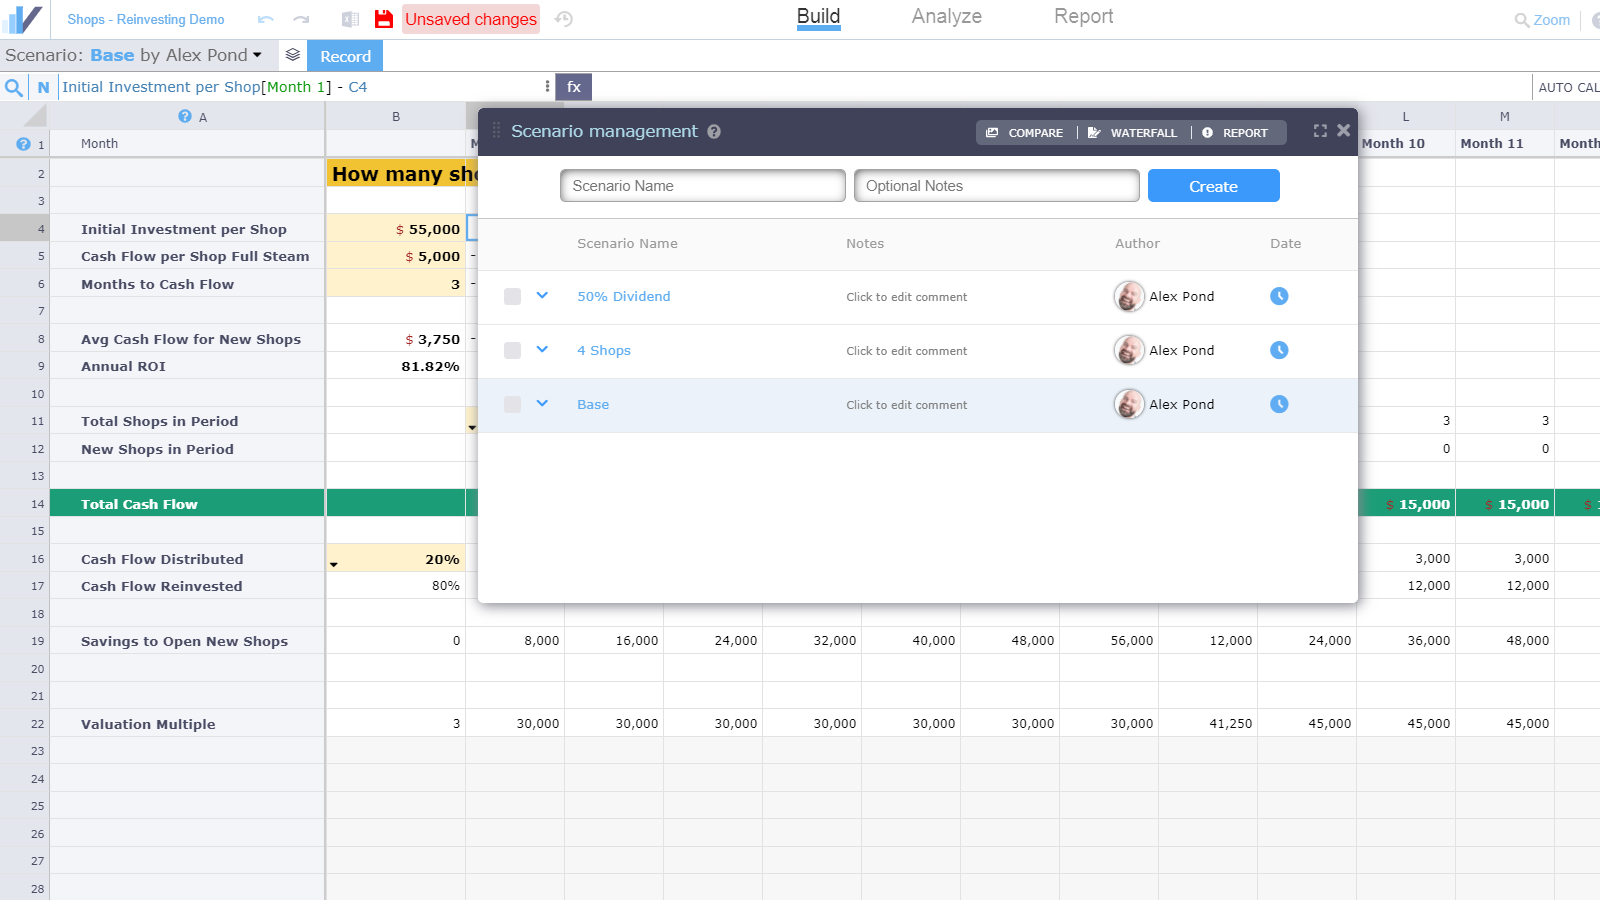
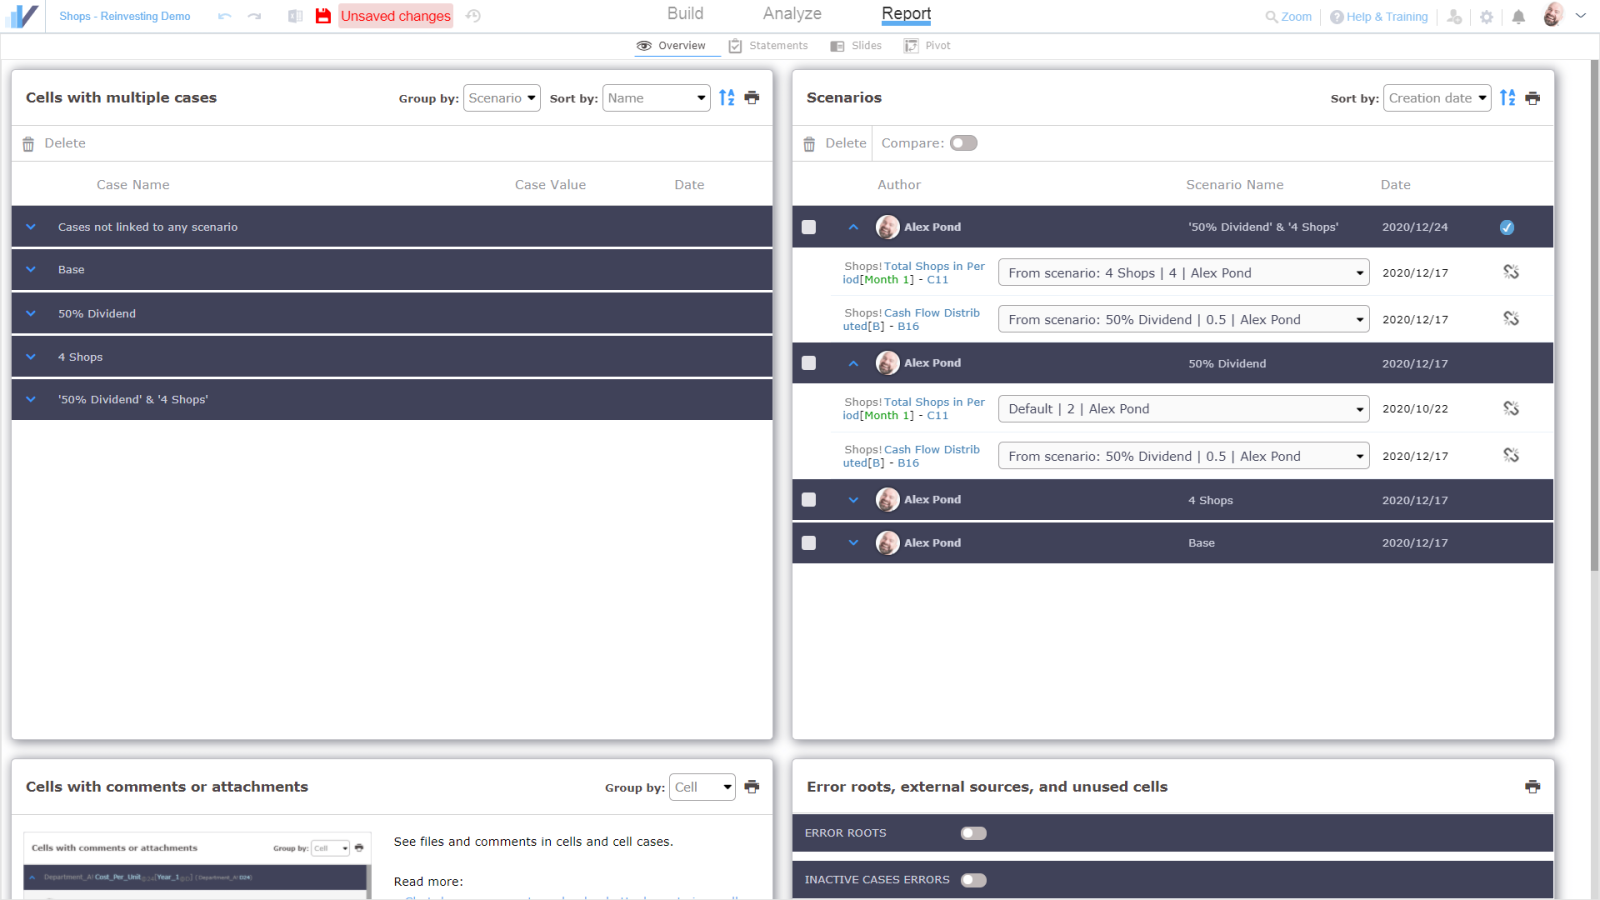
Scenario Management, Comparison, and Analytics
With Visyond’s cloud platform, the modeler and stakeholders can quickly create different scenarios without overwriting each others’ assumptions since Visyond can store multiple values for each cell in parallel. As a result, the collaboration process is more efficient as it avoids the back-and-forth of assumptions or Excel-files, and removes the need for manual updates of the spreadsheet and visualizations on every assumption or scenario change.
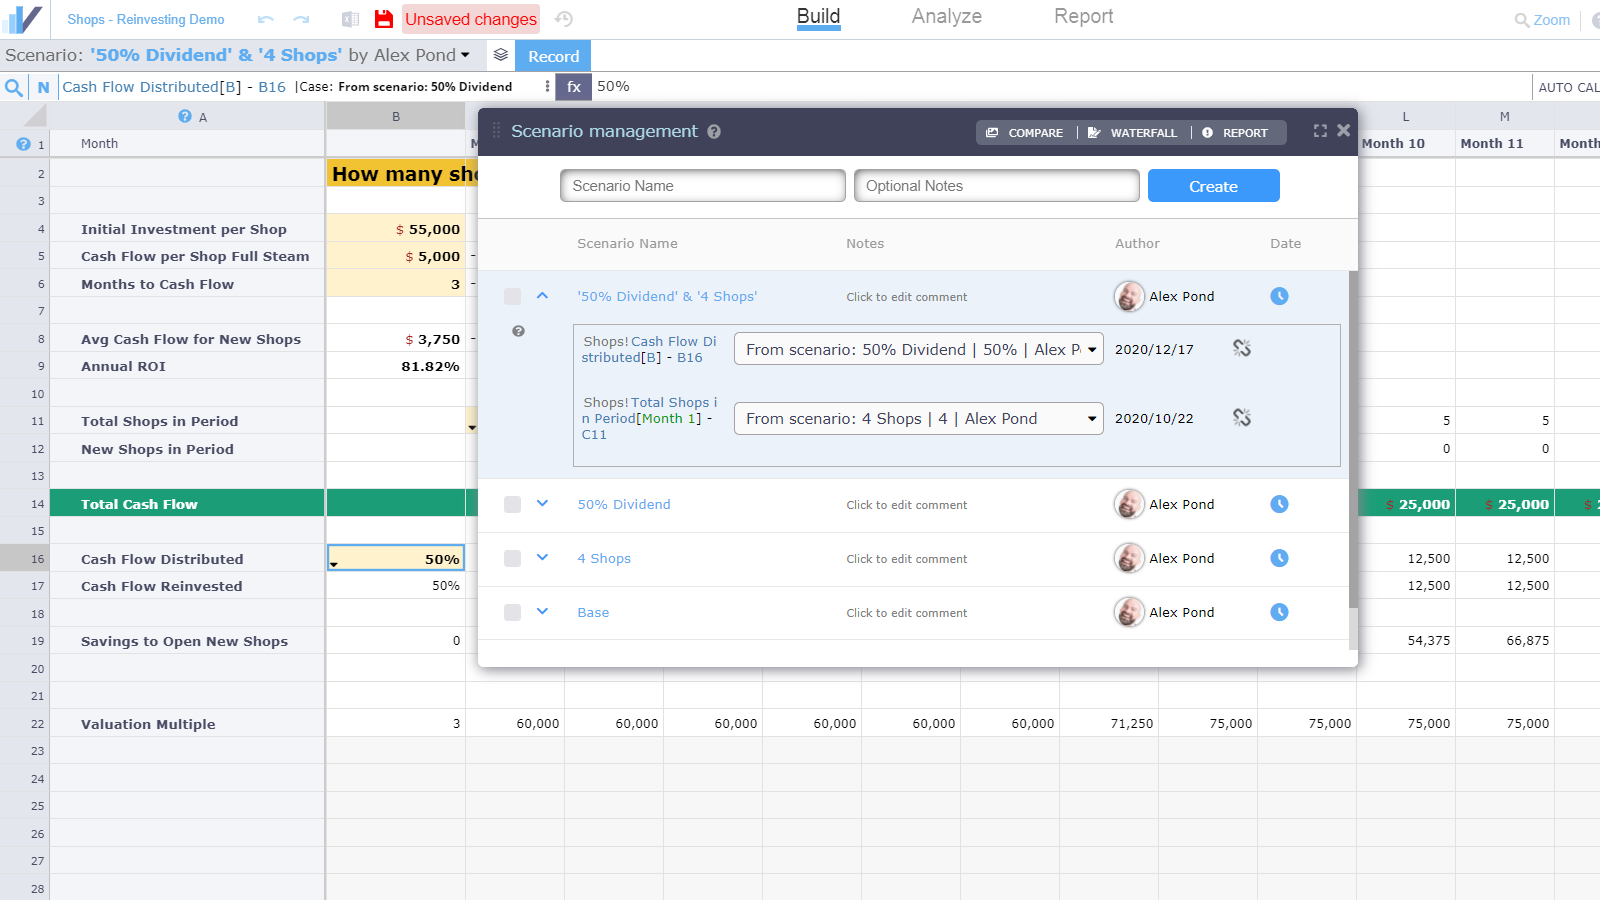
The stakeholders are interested in seeing how the final number of shops changes under the following scenarios:
- ‘Start with 4 shops’
- ‘Reinvest 50% of the generated cash’
They also want to see the effect of the combined scenario - ‘Start with 4 shops and Reinvest 50% of the generated cash’ - which Visyond’s scenario manager helps them create with just a few clicks.
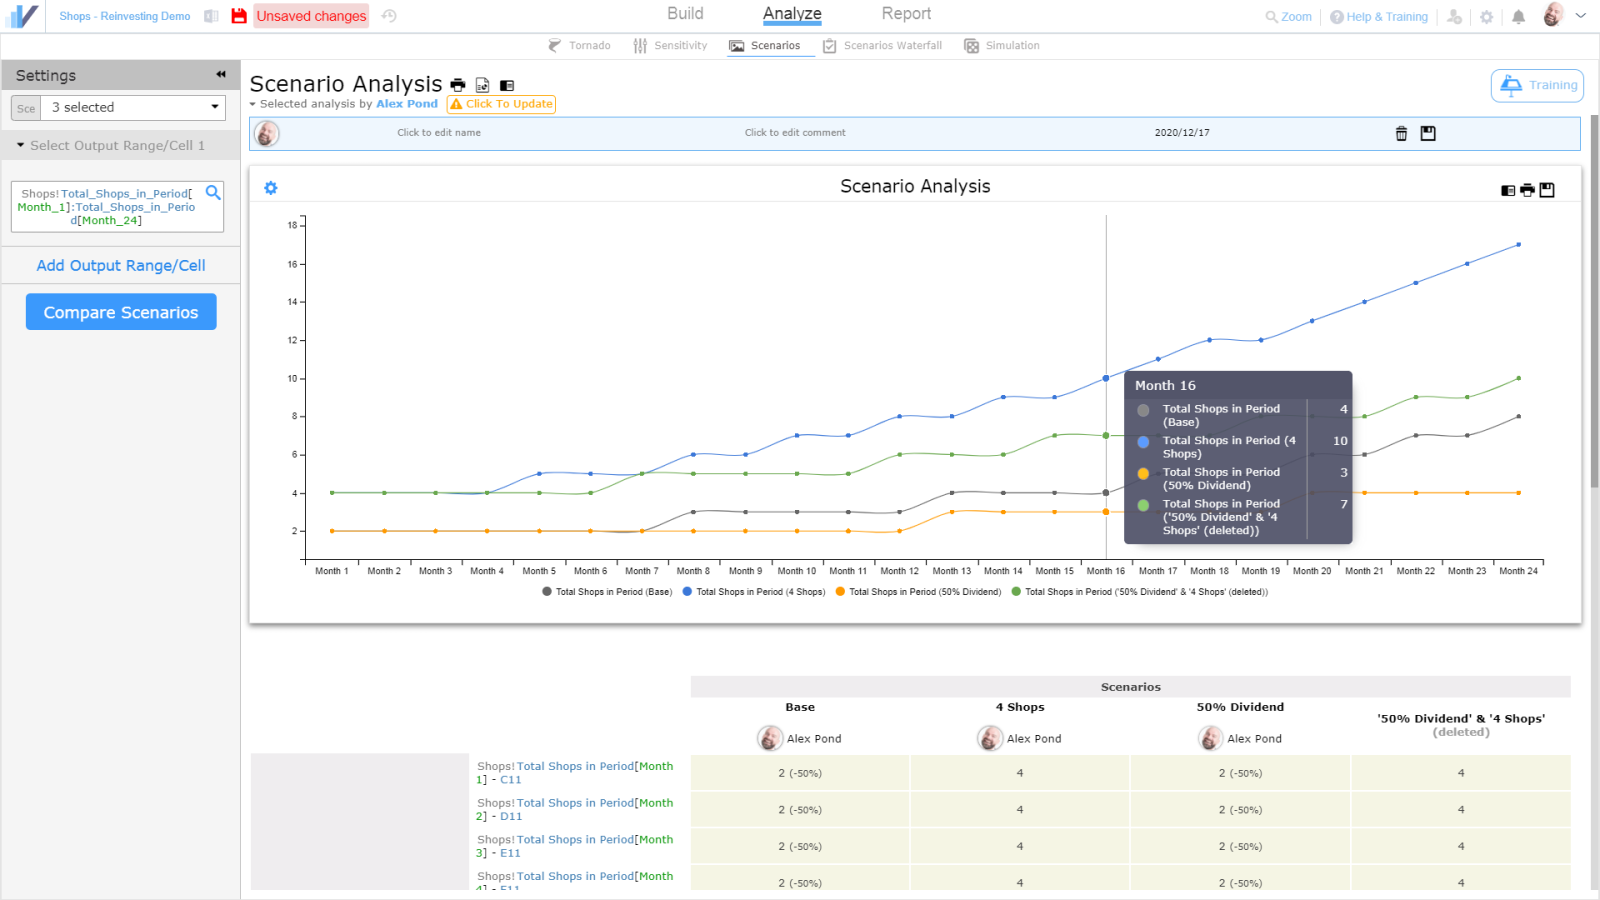
Creating side-by-side visual comparisons is quick, easy and accessible with automated scenario analysis that generates a presentation-ready chart and a value comparison table based on the selected scenarios and output cells or ranges. For example, comparing the Base scenario vs. ‘Start with 4 shops’ vs. ‘Reinvest 50% of generated cash’ vs. a combined scenario.
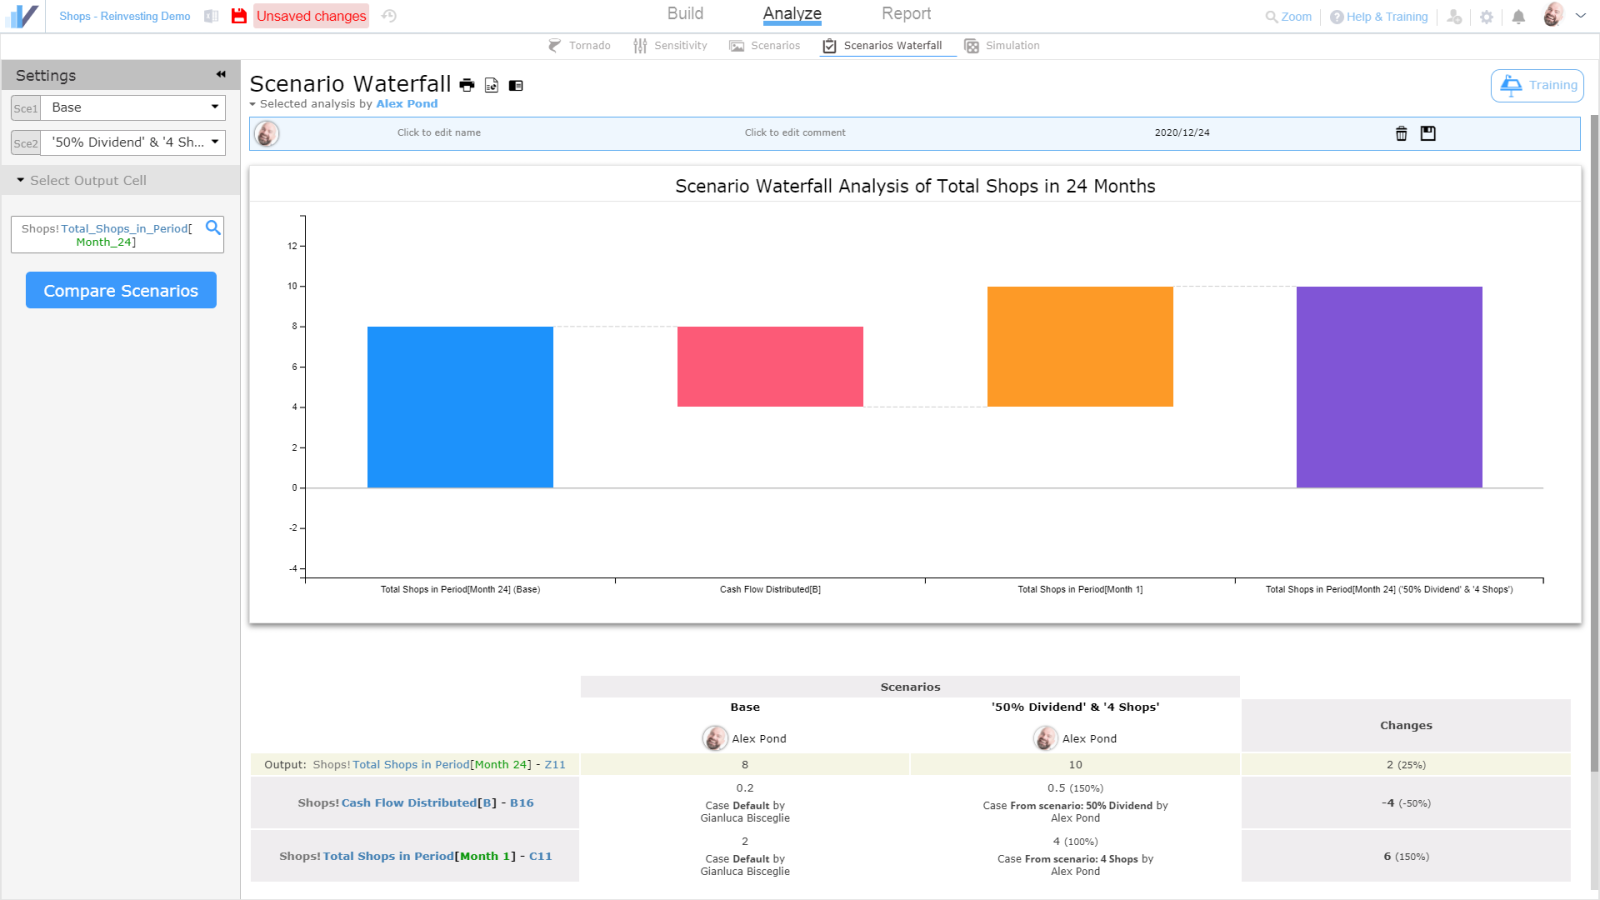
For more information on which cells change between scenarios and by how much, stakeholders can run an automated Scenario Waterfall analysis that will give them the answer.
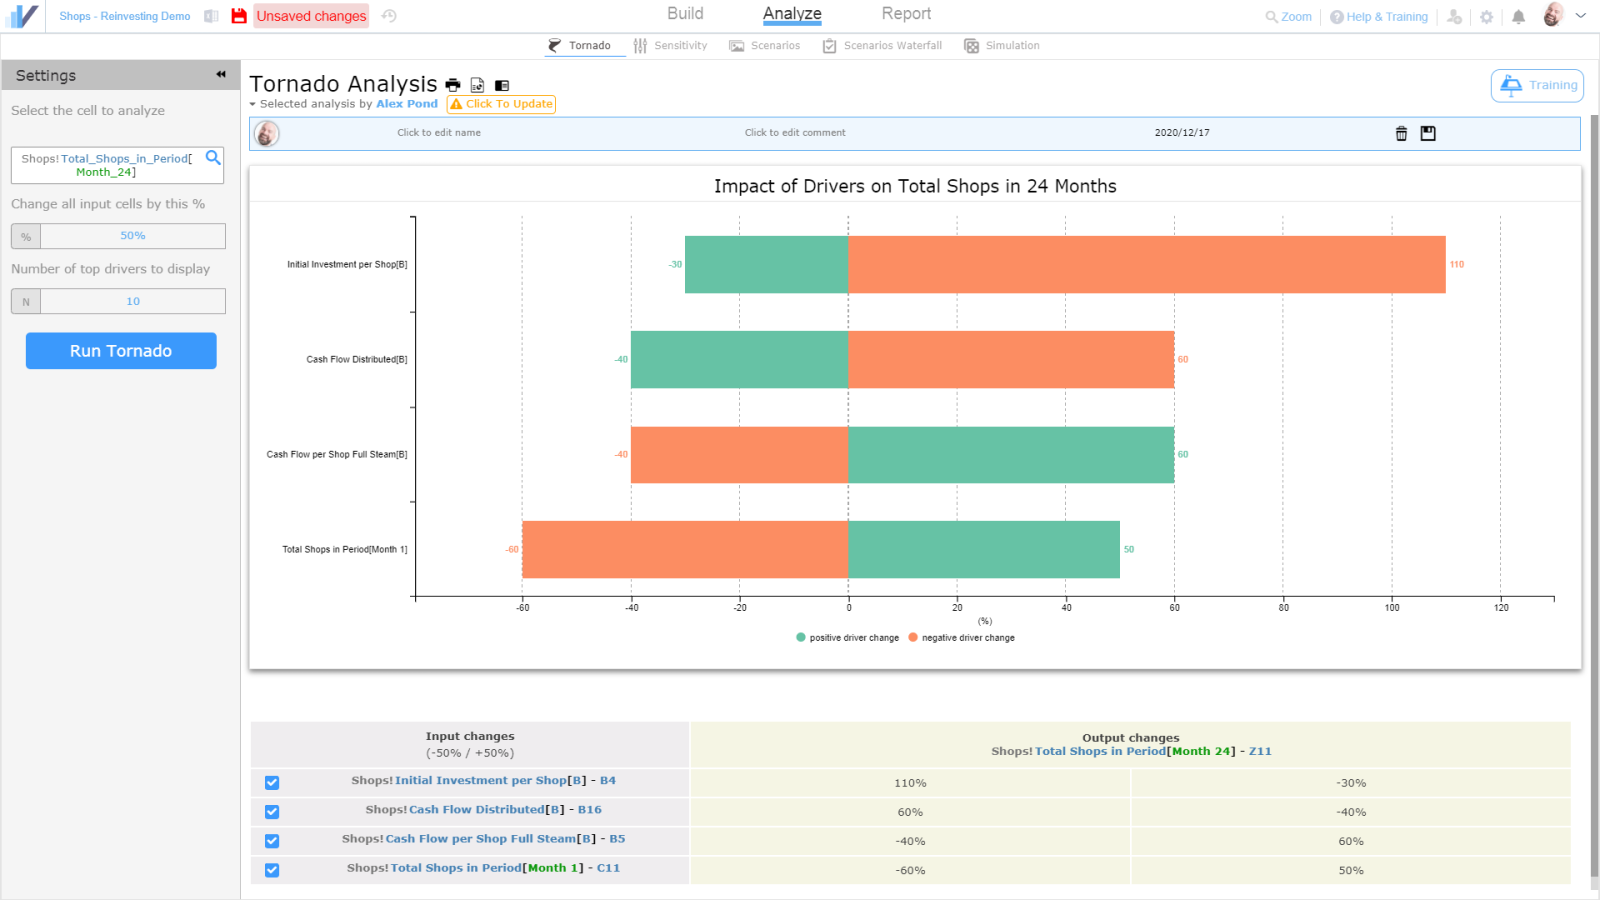
The demo model we are showing here is pretty simple, so we already know what the most important business drivers are for our primary output cell (total number of shops in a period). If it were a more complicated model, however, we would have simply asked the Tornado analysis to tell us what are the most important input cells driving the total number of shops, and how large their impact on the output is. This can be achieved with just a few clicks without any programming knowledge.
As we can see, the initial investment required to open a new shop and the % of cash flow stakeholders want to keep for themselves are among the most impactful business drivers.
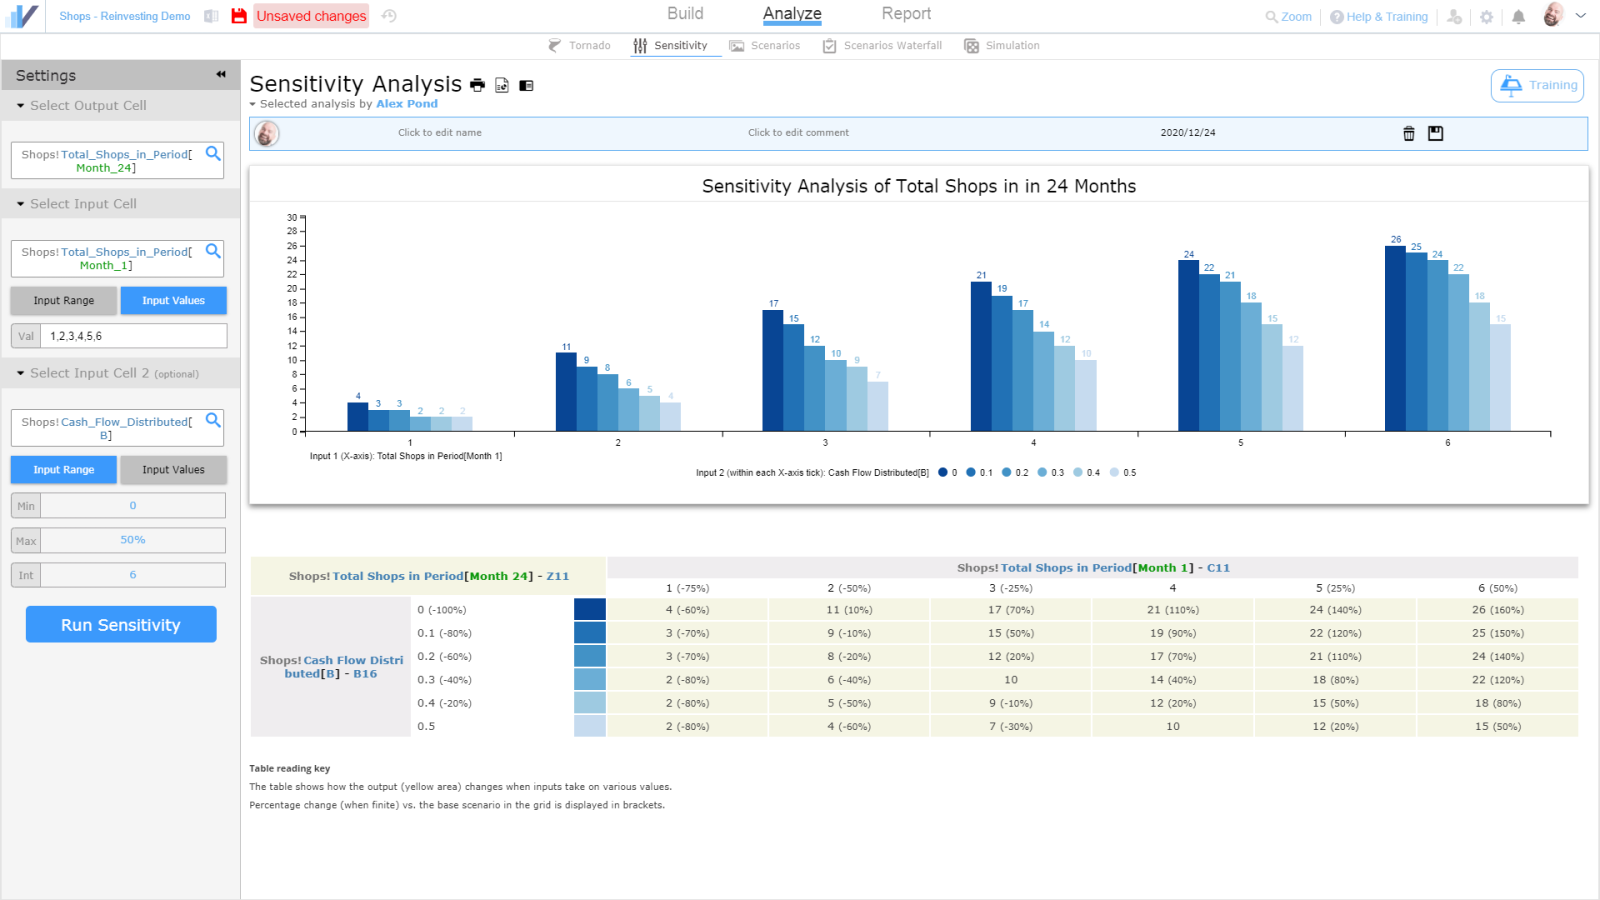
After the important business drivers are identified, we can quickly run an automated Sensitivity analysis to learn how the output (the total number of shops) changes when we vary a certain input driver (e.g. % of cash flow to reinvest) to find the ‘sweet spot’ of cash flow we want to reinvest.
Overall, the analytic automation tools greatly improved stakeholders’ productivity and do not require complicated macros or maintenance.
Self-Service Dashboards and Scenario Testing
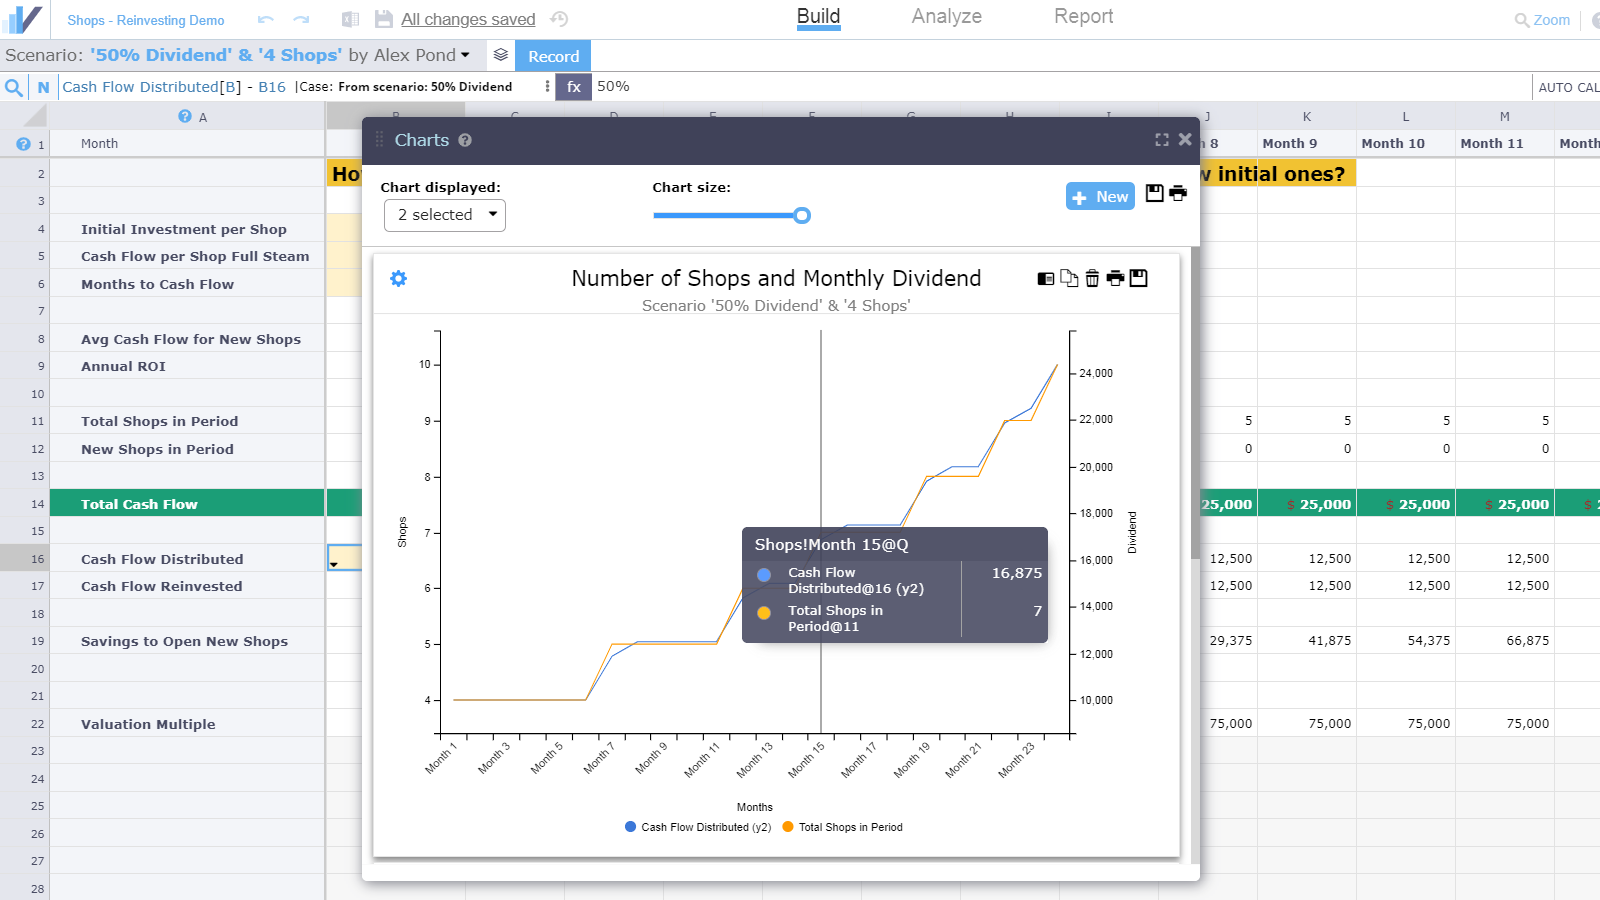
In addition to Scenario Comparison and Waterfall visualizations, stakeholders can easily create always up-to-date charts (e.g. total number of shops and monthly dividend over a period) that immediately respond to changes when a scenario or an assumption is switched.
A very important requirement of the client was to have an interactive dashboard that would allow them to visualize how different assumptions change the outcome without having to locate the input cells in the spreadsheet.
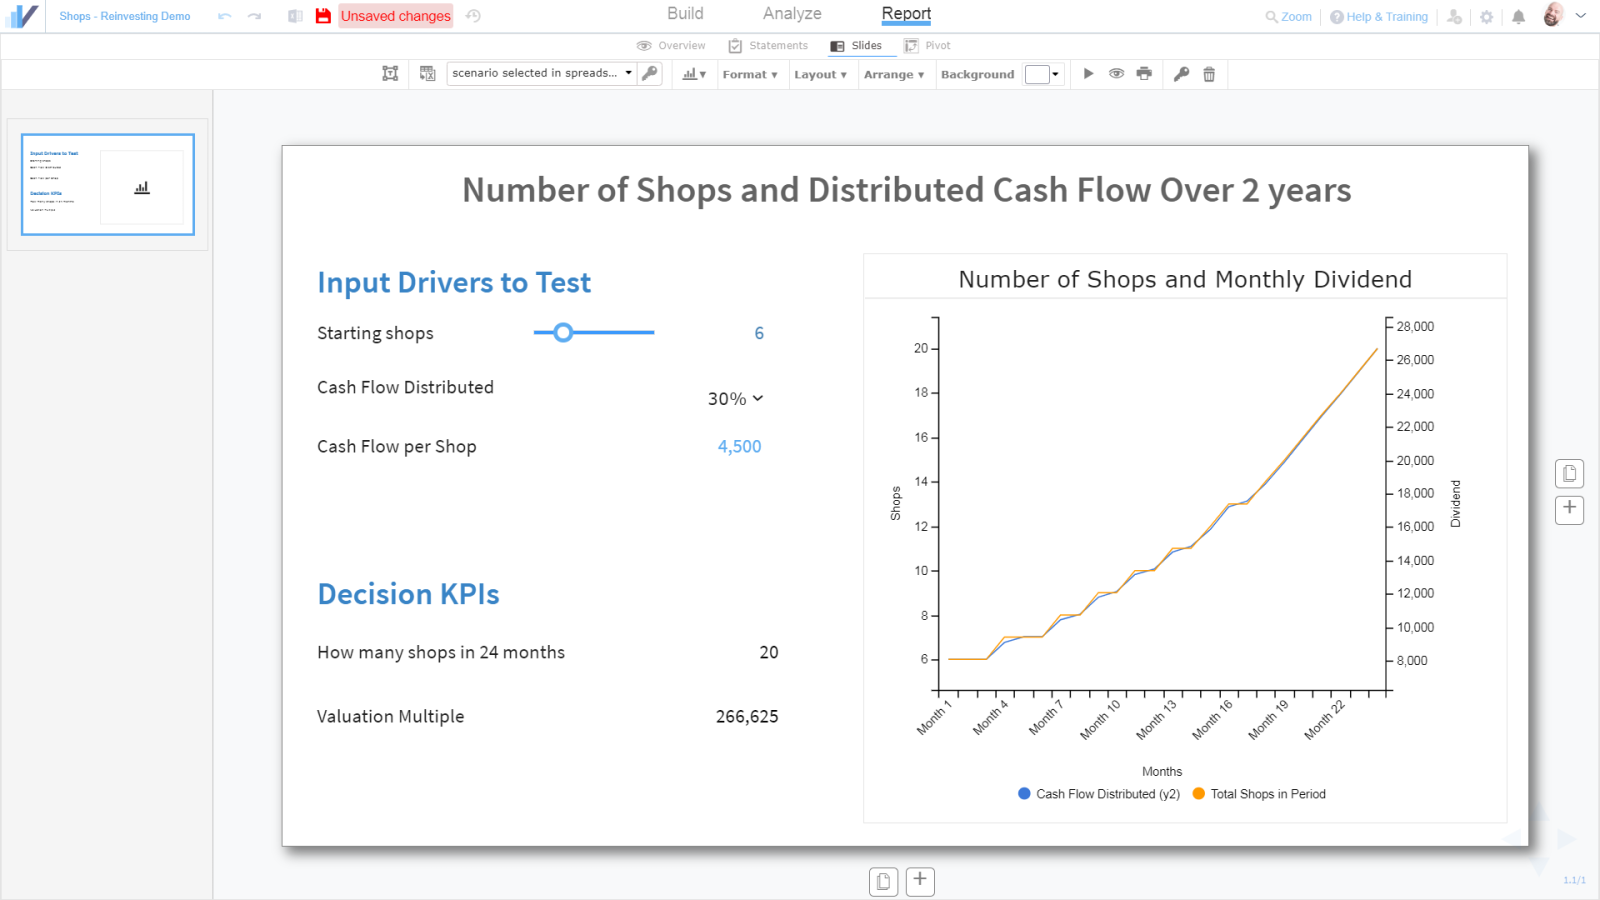
This is achieved by creating a dashboard with:
- Input cells (the most important business drivers, e.g. the cell with % of cash flow to reinvest)
- Output cells (e.g. the number of shops that can be opened in 24 months)
- A chart that visualizes the number of shops and monthly dividends over 24 months
The client wanted some assumptions to be restricted to certain intervals or values so the input cells are presented either as sliders or dropdown lists with predetermined values. By changing these values in the dashboards, stakeholders can visualize any combination of assumptions they can think of (for example, starting with 6 shops, with each generating $4,500/month in cash, and reinvesting 70% of it). As an option, viewers can reset the dashboard to one of the existing scenarios that were previously created in the model.
When interacting with the model through dashboards, each stakeholder does so in their own isolated ‘stress-testing bubble’, and anything that they do there, does not impact the view of other stakeholders who access the same dashboard simultaneously, nor does it introduce any changes to the spreadsheet itself.
The dashboards remain always up-to-date. Any changes to the model, its scenarios, analyses or charts become immediately available in the relevant dashboards, which removes the need for manual maintenance.
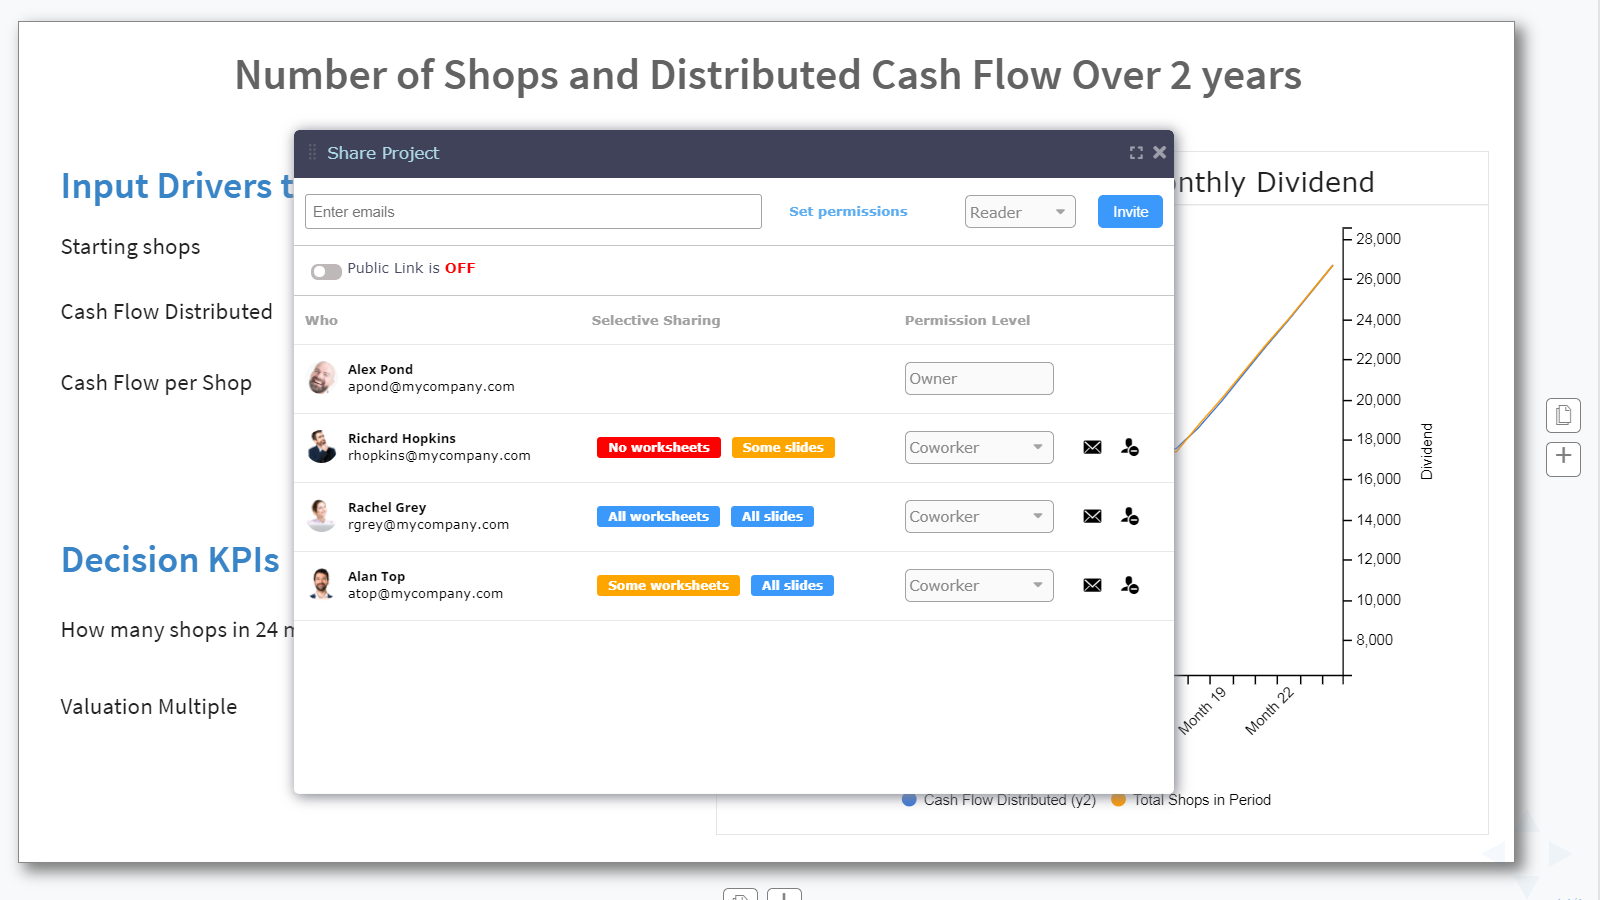
Secure Collaboration
Moving the workflow into Visyond’s cloud solution improves the collaboration between stakeholders, helps them collectively contribute assumptions, scenarios, charts and analyses. It also allows stakeholders to consume the outputs of the model and test scenarios through interactive, self-service dashboards.
The platform ensures data integrity by storing each and every created assumption and scenario in parallel with the ability to switch between and mix-and-match them at any time. In addition, Visyond improves accountability by tracking who and when added a certain assumption or modified a certain cell.
The role- and object-based permission system ensures that only authorized stakeholders can access specific parts of the model. For example, the model owner can choose to hide the spreadsheet part from everyone except themselves, and let other stakeholders see only the interactive dashboards, through which they can independently test assumptions without introducing any changes to the spreadsheet or breaking it accidentally.
Try Visyond without signing up
See interactive demoFeatured Case Studies


Get started today
- Leverage Excel skills
- Do in minutes what takes days for others
- Be productive, insightful and in control