

Managing Logistics and Analyzing Risks with Monte Carlo Simulations
- Industry: Logistics and Supply Chain
- Use Case: Monte Carlo Simulations, Tornado and Sensitivity Analysis
Summary
Challenge
- The team needed to collaborate on risk management and running Monte Carlo simulations.
- Additional software on top of Excel had to be installed for every stakeholder.
- PowerPoint presentations had to be manually updated and shared with stakeholders.
Solution
- Ability to find the probability distribution of Freight Rates and Fuel Costs based on historical data, on the same platform where the model and its assumptions are.
- Run Monte Carlo simulations in a few clicks based on the distribution found.
- Cloud-based, collaborative environment eliminates the need to install add-ons on multiple machines.
- End-to-end integration of spreadsheet, simulations and reporting dashboards automates updates of visualizations and analyses.
- Secure, role- and object-based selective sharing reduces the risk of data leaks during data gathering and when sharing dashboards with stakeholders.
Results
- Without installing and maintaining additional software on every stakeholder’s machine or moving data across tools, the customer can easily assess the evolution of probable open positions results based on evolving assumptions, and confidently manage value at risk based on the calculated probabilistic outcomes.
- Customers can communicate the performance risk through dashboards that are managed in one place, and seen only by specific stakeholders, without the need to copy-paste data points and charts to static slides at every assumption change.
- Stakeholders can stress-test the assumptions in a safe environment where they are the only one seeing the output driven by their changes and where they cannot accidentally break the underlying spreadsheet.
Case Study
Founded in the 1970s, the Switzerland-based company focuses on operation and co-ownership of vessels, asset management, investment services, the all-round management of shipping investment projects, and has provided consultancy services to banks, financiers, flag states and major ship-owning groups.
Software Management
Manual software setups complicated the process
Additional software on top of Excel had to be installed on the machine of every stakeholder who needed to run Monte Carlo Simulations or was involved in the Risk Management process by providing assumptions, comments, or decisions.
This approach was not easily scalable and required manual setup for each stakeholder making it time-consuming. Periodic checks had to be made to ensure that everyone had access to the tools they needed.
With Visyond, stakeholders always have the tools they need at hand
There is no need to install software on every stakeholder’s machine for them to participate in the risk management and decision-making process. All they have to do is open Visyond in the browser to get access to all the tools they need. This also made working remotely much easier, and improved the team’s flexibility.
Data Gathering
Tracking assumptions and Excel versions was difficult
Tracking assumptions was becoming more challenging the more people participated in the process. There was always a risk of accidentally losing information in long email threads, and the frequent exchanges of Excel files contributed to the risk of exposing sensitive data and version chaos, which further lengthened and complicated the data gathering process.
With Visyond, data governance was automated
All stakeholders collaborate and contribute assumptions in one place, thus creating the single source of truth for decision makers. Inputs from different stakeholders don’t overwrite each other like they did in Excel, and it’s always possible to trace who added certain assumptions and when. In addition, attaching files to relevant cells provided context for the data, and helped create a shared knowledge base.
The role- and object-based selective sharing system allows to share only specific data-input worksheets with specific stakeholders, without exposing the rest of the spreadsheet, thus reducing the risk of data leaks and accidental changes to the model.
Data Preparation
Moving data across tools was inconvenient and error-prone
After the assumptions were gathered, additional time was required to review the data to make sure it was consistent and ready to be used in external tools. The newly added assumptions weren’t always immediately available for analysis because the stakeholder running the analysis and the stakeholder providing the data were not always the same person.
With Visyond, the model, its assumptions, analyses and visualizations are part of the same platform
The Visyond platform provided end-to-end integration of the spreadsheet model, its assumptions and scenarios, historical data, analyses and reporting dashboards. Without additional data staging, the new data is immediately available in the analysis modules, which, in turn, produce presentation-ready outputs.
Analyses and Simulations
Simulations were non-collaborative
When different stakeholders ran simulations in parallel, they could not easily see what the others were doing - the parameters, assumptions and historical data they used. It was not easily possible to take someone’s simulation setup as a base, tweak it and run with slightly different parameters to see how they’d affect the distribution and answer ‘what-if’ questions.
With Visyond, simulations became automated and collaborative
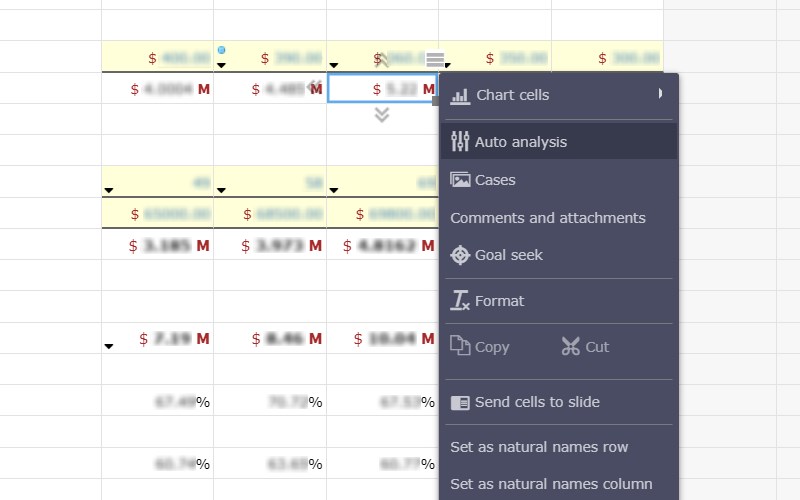
The simulations are automated with the ‘auto-analysis’ that performs a ‘quick and dirty’ analysis using heuristics, which then can be easily modified and tweaked as needed.
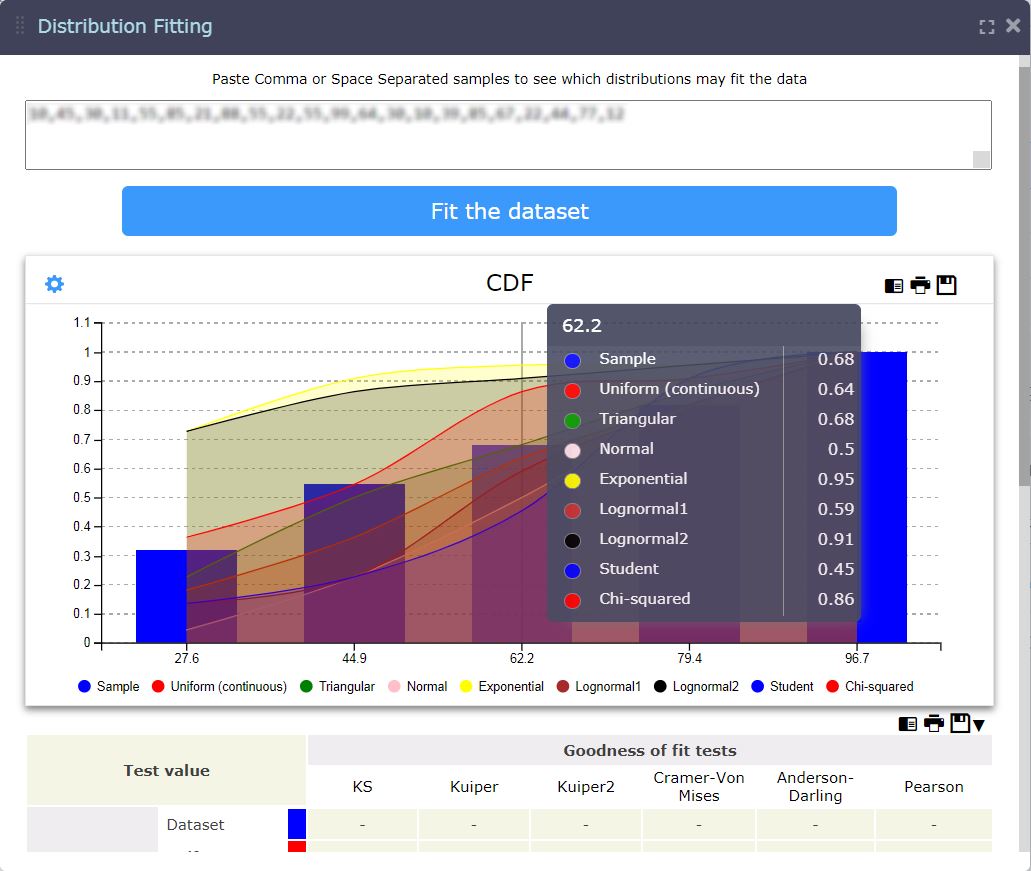
To help find the fitting distribution, Visyond provides an interface to get the distribution by analyzing historical data.
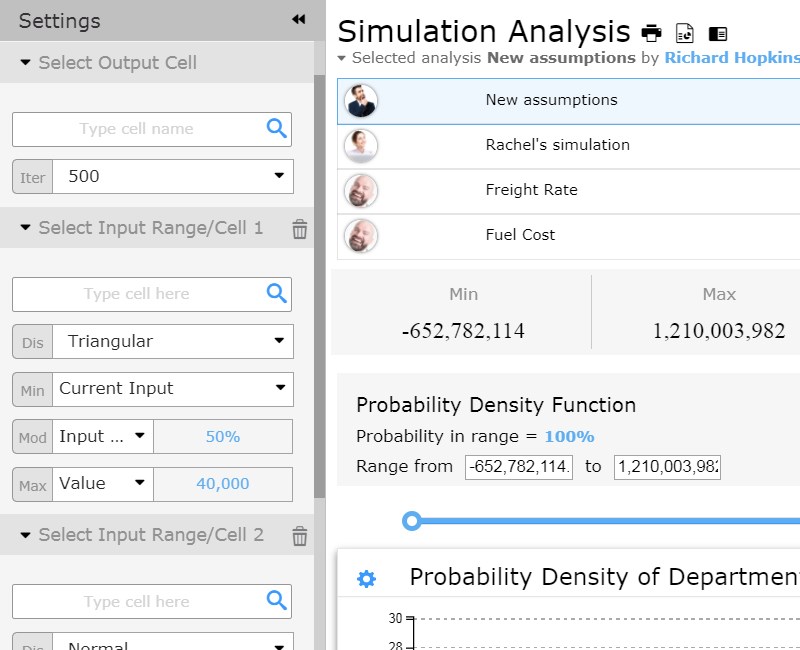
The customization of simulations is straightforward- select the KPI that needs to be simulated, the number of iterations, the assumptions to model probabilistically, and parameters in the order they are presented in the settings panel, and then press ‘Run’.
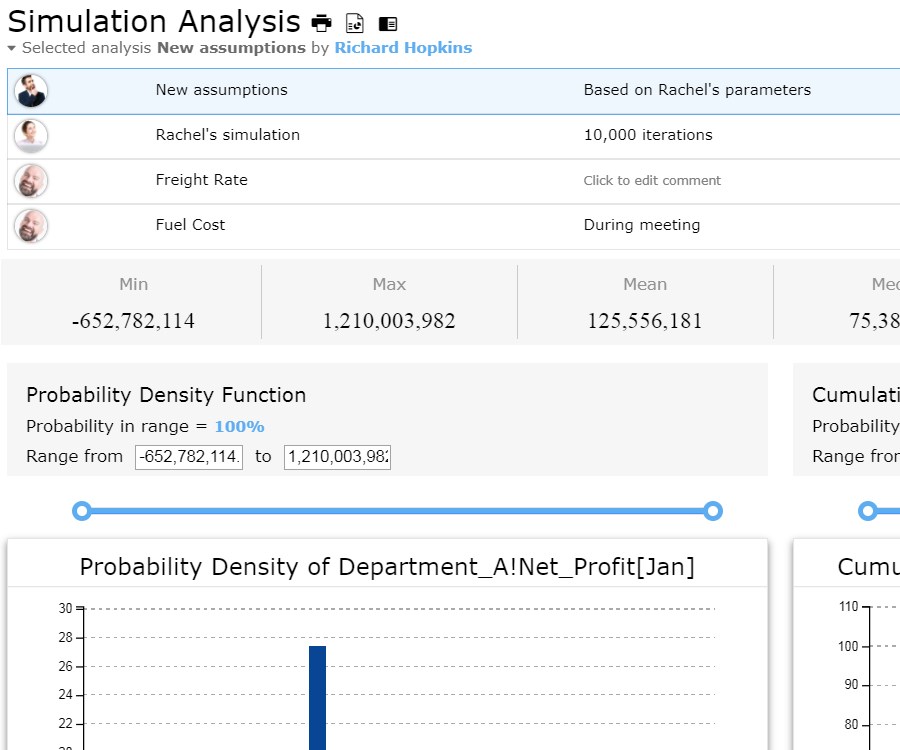
The stakeholders can view the simulations run by others, and then run their own analyses based on them - without modifying, overwriting or deleting any data.
Management Reporting
Static and manually updated presentations were overwhelming the modeler
Presentation and charts needed to be updated every time the assumptions or the parameters behind the simulation changed. Visualizations were static, and stakeholders had to get in touch with the modeler if they wanted to stress-test new assumptions and get updated visualizations.
With Visyond, analyses are always up-to-date, and interactive dashboards let stakeholders securely stress-test assumptions on their own
Monte Carlo simulations module produces presentation-ready outputs that can be added to interactive dashboards with a single click. The chart in the dashboard is linked to the analysis module, and when the analysis is re-run with the new data or parameters, the corresponding dashboard is automatically updated.
Input and output cells from the model can be added to the dashboard in the form of sliders and dropdowns, allowing stakeholders to interact with the model and answer ‘what-if’ questions in self-service mode, without seeing, touching or modifying the underlying spreadsheet or data.
Stakeholders who aren’t working with the spreadsheet directly are shielded from the complexity of the model, and the model is, in turn, protected from accidental changes by stakeholders with the help of permission-based system that allows to expose only specific dashboards with specific inputs and outputs only to specific stakeholders.
The dashboards and presentations are shared via links or can be viewed directly in the platform.
Beyond Simulations
With Visyond, simulations and analyses are accessible and easy to use
Visyond does not have complicated menus that need to be memorized - all available actions are contextual and accessible with right-click. All the modules have similar layouts and come with a training mode that guides users through the modules step-by-step, allowing stakeholders to start contributing value quickly and without going through a steep learning curve.
Besides simulations, stakeholders can now quickly identify the cells that have the greatest impact on important output cells, perform sensitivity analysis with a few clicks, and easily create and compare scenarios on-the-fly.
With Visyond, there is more control over the decision-making process
By putting the model, its assumptions and scenarios at the center of the ecosystem of automated analysis tools and interactive dashboards, the Visyond platform has become a one-stop-shop that connects modelers, analysts, decision makers and other stakeholders together in a single secure environment.
With Visyond, it’s easier to understand the model structure
Error root cause analysis and anomaly detection save a lot of time tracking errors in the model. Natural language formula names make it easier to communicate the structure of the model to other stakeholders and understand the formulas.
Try Visyond without signing up
See interactive demoFeatured Case Studies

Get started today
- Leverage Excel skills
- Do in minutes what takes days for others
- Be productive, insightful and in control