

Elettronica Reduces the Sales Planning Cycle from Weeks to Hours
- Industry: Electronics Manufacturing
- Use Cases: Territory & Quota Planning, Sales Planning
Summary
Challenge
- Legacy spreadsheet-based Sales planning process was time-consuming and impractical.
- Sharing the master spreadsheet with colleagues caused extra stress due to risk of unwanted changes or data corruption.
- Scenario planning and analysis was cumbersome.
- Collecting assumptions from team members involved long and chaotic e-mail exchanges.
- Routine analytical tasks had to be done manually requiring significant time investement at every at every iteration.
Solution
- Single, cloud-based Territory & Quota data model.
- Visyond Replaced multiple copies of the spreadsheets sent and consolidated manually with Visyond dynamic cases and scenarios managed.
- Visyond introduced real-time collaboration to the existing workflow and made the process much faster.
- Transparency and accountability for data input Results at a Glance.
Results
- Process completed in hours instead of the typical few days with Excel-based process: at least 20 times faster.
- Clarity for every stakeholder about different versions of data and impact of their assumptions.
- Separate paperwork and notes have been eliminated thanks to auto reporting.
- Ability to create different versions of the plan and compare scenarios in real-time.
- Simplicity and quick turnaround for ‘what-if’ assumption changes.
Case Study
Fernando is a Sales Manager at Elettronica, a company of more than 800 employees active in the defense sector and selling its solutions worldwide.
Fernando leads the preparation of forecasts and plans for the top management, and recommends where to allocate resources to optimise the sales process.
“It was a very time consuming process with a high risk of mistakes at each step, due to the manual implementation and the large set of inputs.”
Before Visyond
This is how Fernando’s job look like:
- He had a Sales Forecast model set up in Excel that was hard to maintain as it contained a lot of complex calculations and references to different parts of spreadsheet and external sources.
- He had to manually collect inputs in meetings, via emails or calling each colleague. Chasing colleagues was a very time-consuming and stressful task but it did not end there - after all the numbers were gathered, Fernando had to pull all of the notes and received emails and enter the data into the spreadsheet.
- Sometimes, he found multiple inputs from the same person and they contradicted each other or simply did not make sense, and so Fernando had to go back to people who provided the numbers for additional clarifications which then resulted in having to perform the spreadsheet update once again.
- Then there were the colleagues who liked to create a copy of the Excel file, fill-in their assumptions and send the file back to Fernando: consolidation of data from these multiple files was a daunting task. Besides, by the time Fernando received the file with the updated data, his “master copy” had changed as a result of debugging and fixing errors, updating the calculations or changing the structure of the model to respond to senior management‘s requests. The data from the older versions of the file sent by the colleagues had to be then manually added to the most recent version of the model, sometimes uncovering new inconsistencies and errors.
- Every three months he had to prepare a new set of spreadsheets and create several sets of different hypothesis/scenarios, each time rerunning the numbers. This was not only inconvenient because of the large amount of slightly different versions of essentially the same file that had to be maintained but also because it was very hard to keep track to whom each version should be sent, and what inputs should each person consequently provide.
- Finally, at each round there were specific requests from senior management that led to the preparation of customized reports and charts. Those reports have sometimes been based on different versions of the model as they contained different assumptions and scenarios. Often, by the time a custom report or chart has been completed, the management asked to test other assumptions and their impact, so Fernando had to go back to the model to tweak it, modify the numbers and update the visualizations.
“Visyond’s automated tools are saving me a lot of time. It took me days to stress test my forecasts and it now takes me a few clicks. This also gives me peace of mind that nothing will be forgotten or broken accidentally.”
After Visyond
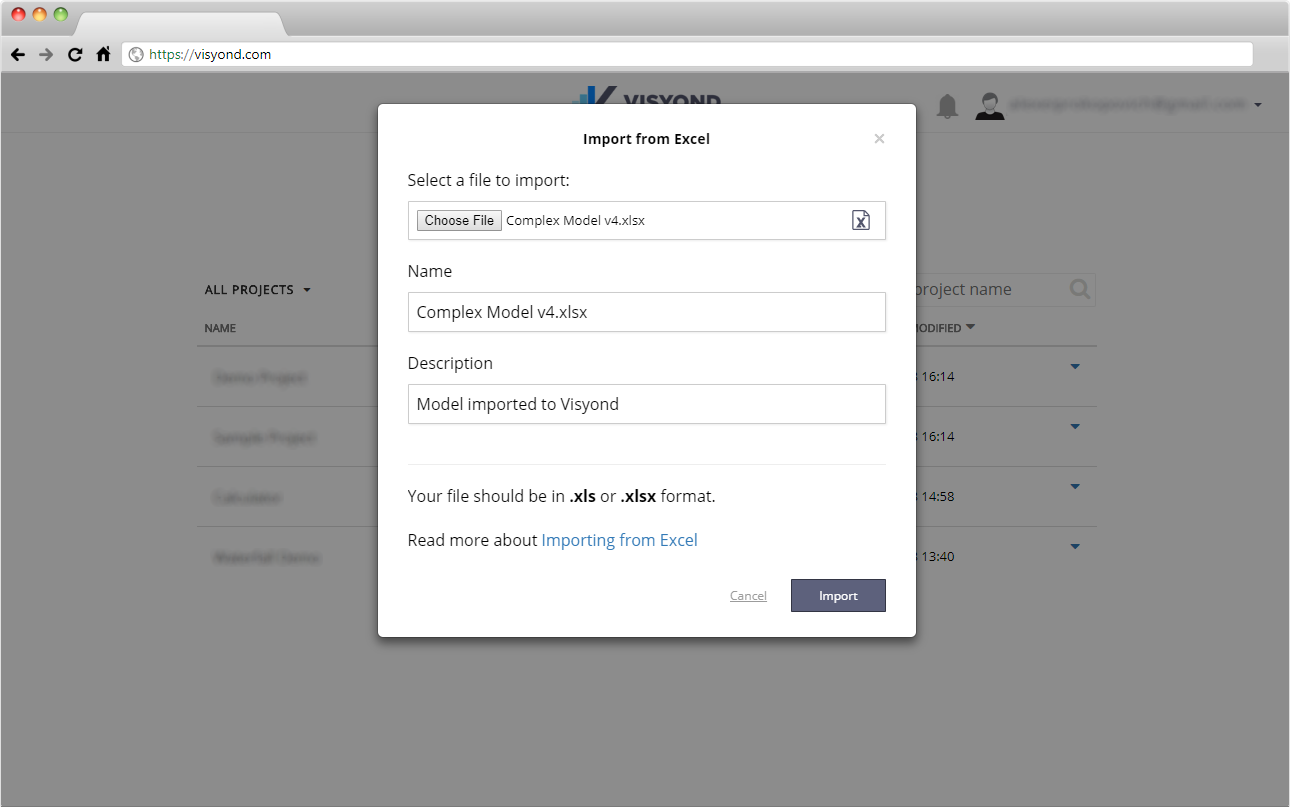
- First of all, Fernando imported his model to Visyond cloud spreadsheet with all the calculations and references. He now had a single place to maintain and update the model, and manage inputs and versions, from any device and any place, without being locked to local files.
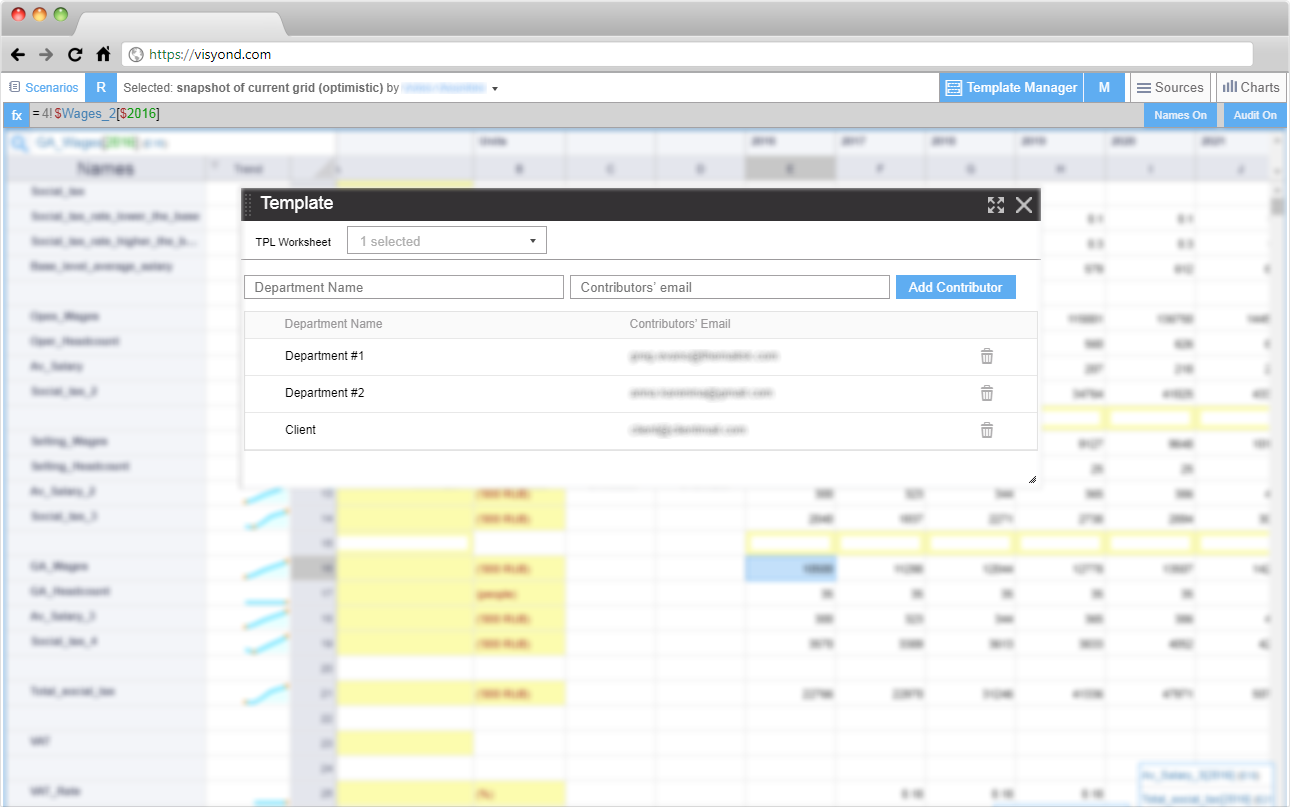
- Visyond’s Selective Sharing allows him to share only specific elements of the model with his colleagues. For example, he can share just an input worksheet with a person who needs to provide an assumption but otherwise should not have any visibility of the model.
- With his fellow sales managers, Fernando sometimes shares calculation worksheets so that they can together verify the correctness of calculations and save time. The comments, assumptions and supporting materials his close collaborators provide are all automatically tracked and documented so everybody sees a single version of the latest work.
- With the senior management, Fernando shares only interactive slides, reports and dashboards, without allowing them to access the model directly thus reducing the risk of accidentally overwriting important formulas or data, while not limiting the management’s ability to test their own assumptions, play with the numbers, and get valuable business insights to make their decisions. Senior management is very happy because they do not have to interact with all the unnecessary details in the spreadsheet.
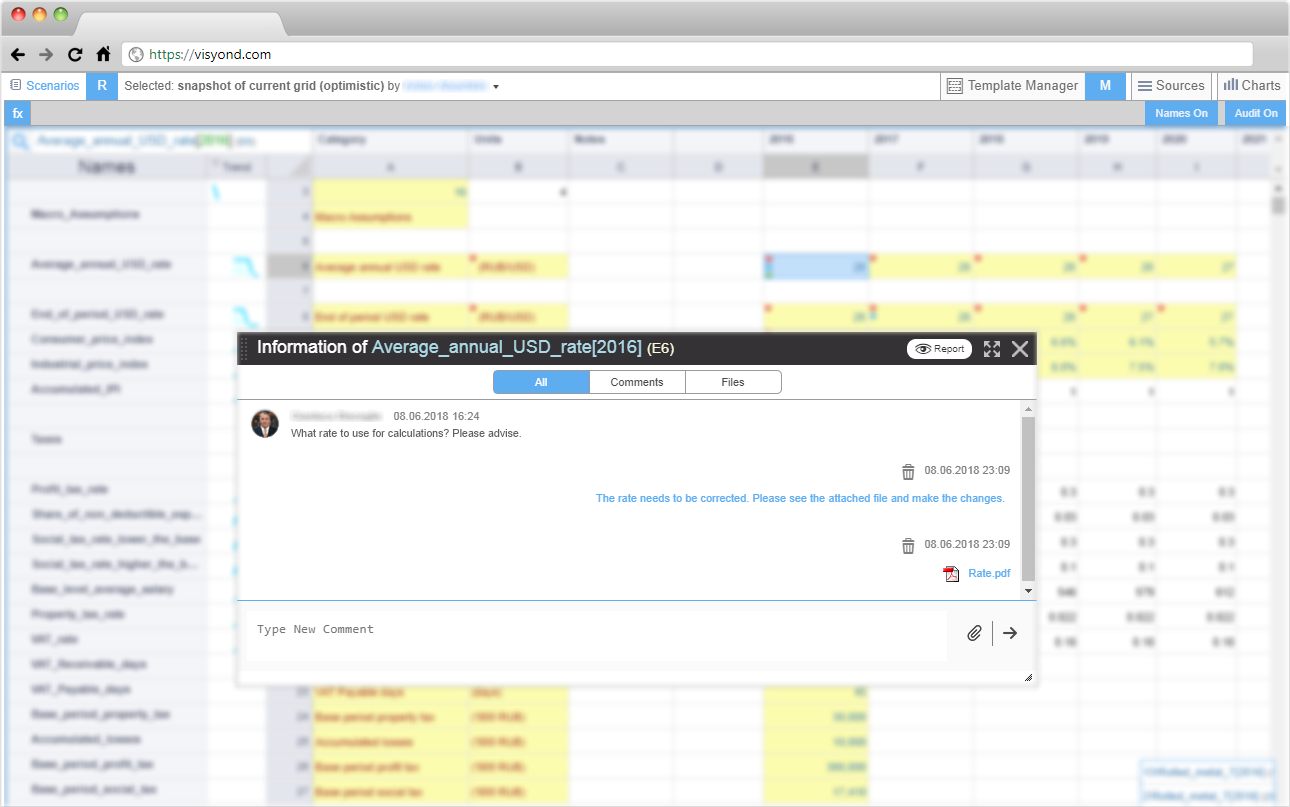
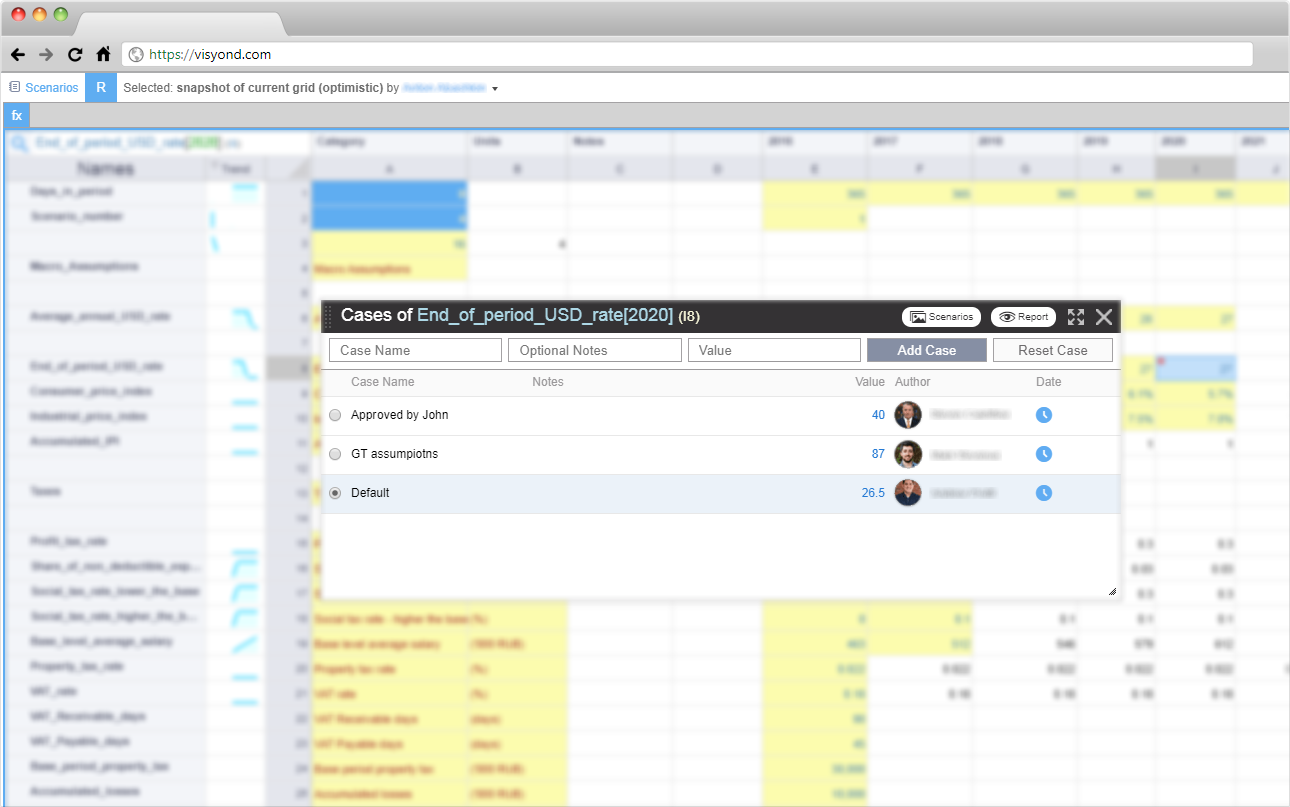
- Since each cell in Visyond can not only store multiple coexisting inputs (cases/assumptions) but also conversations and attachments, Fernando can get the reasoning behind the numbers he receives and verify them quickly.
- When working on forecasts, Fernando had to compare how an indicator would impact the overall result if said indicator would have different values. With Visyond he simply asks his colleagues to add different cases to the cell of interest (for example, ‘optimistic’ or ‘pessimistic’ cases).
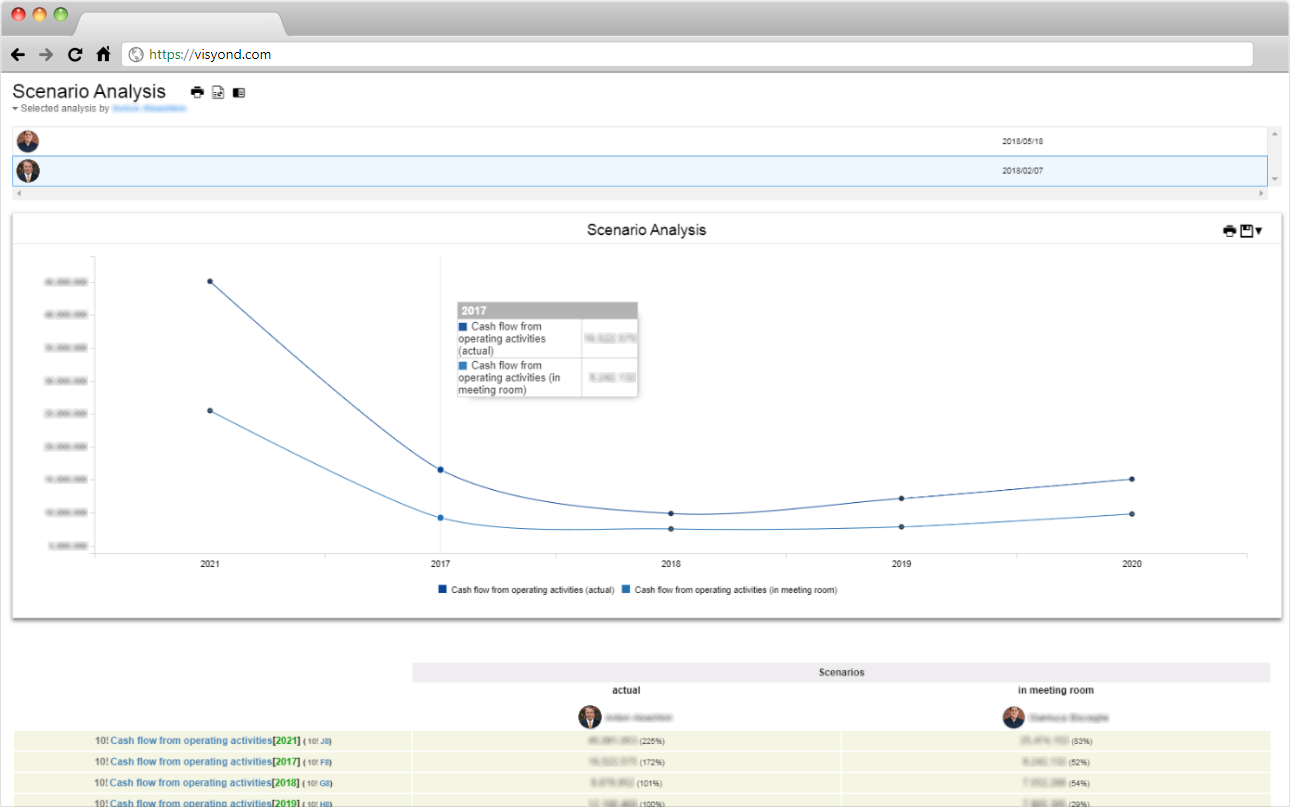
- Then, using Visyond’s Scenario Comparison, in a few clicks he can quickly compare multiple scenarios and observe the differences on automatically generated charts. These visualizations can be easily shared with senior management without having to create and maintain different files, unmaintainable model structures or writing macros.
- Visyond allowed Fernando to greatly speed up the preparation of charts, reports and forecasts. Previously, each presentation was linked to a specific version of the model and had to be stored together, and if there was any change in numbers in the source file the link had to be manually updated. If the file was renamed the link got broken and had to be created again. In Visyond, Fernando does not have this problem anymore as reports, charts and forecasts are part of the same model but securely located in a different layer. Charts and reports can be easily generated in a few minutes without coding, and changes to the underlying model automatically update reports and charts thus eliminating the need for maintenance.
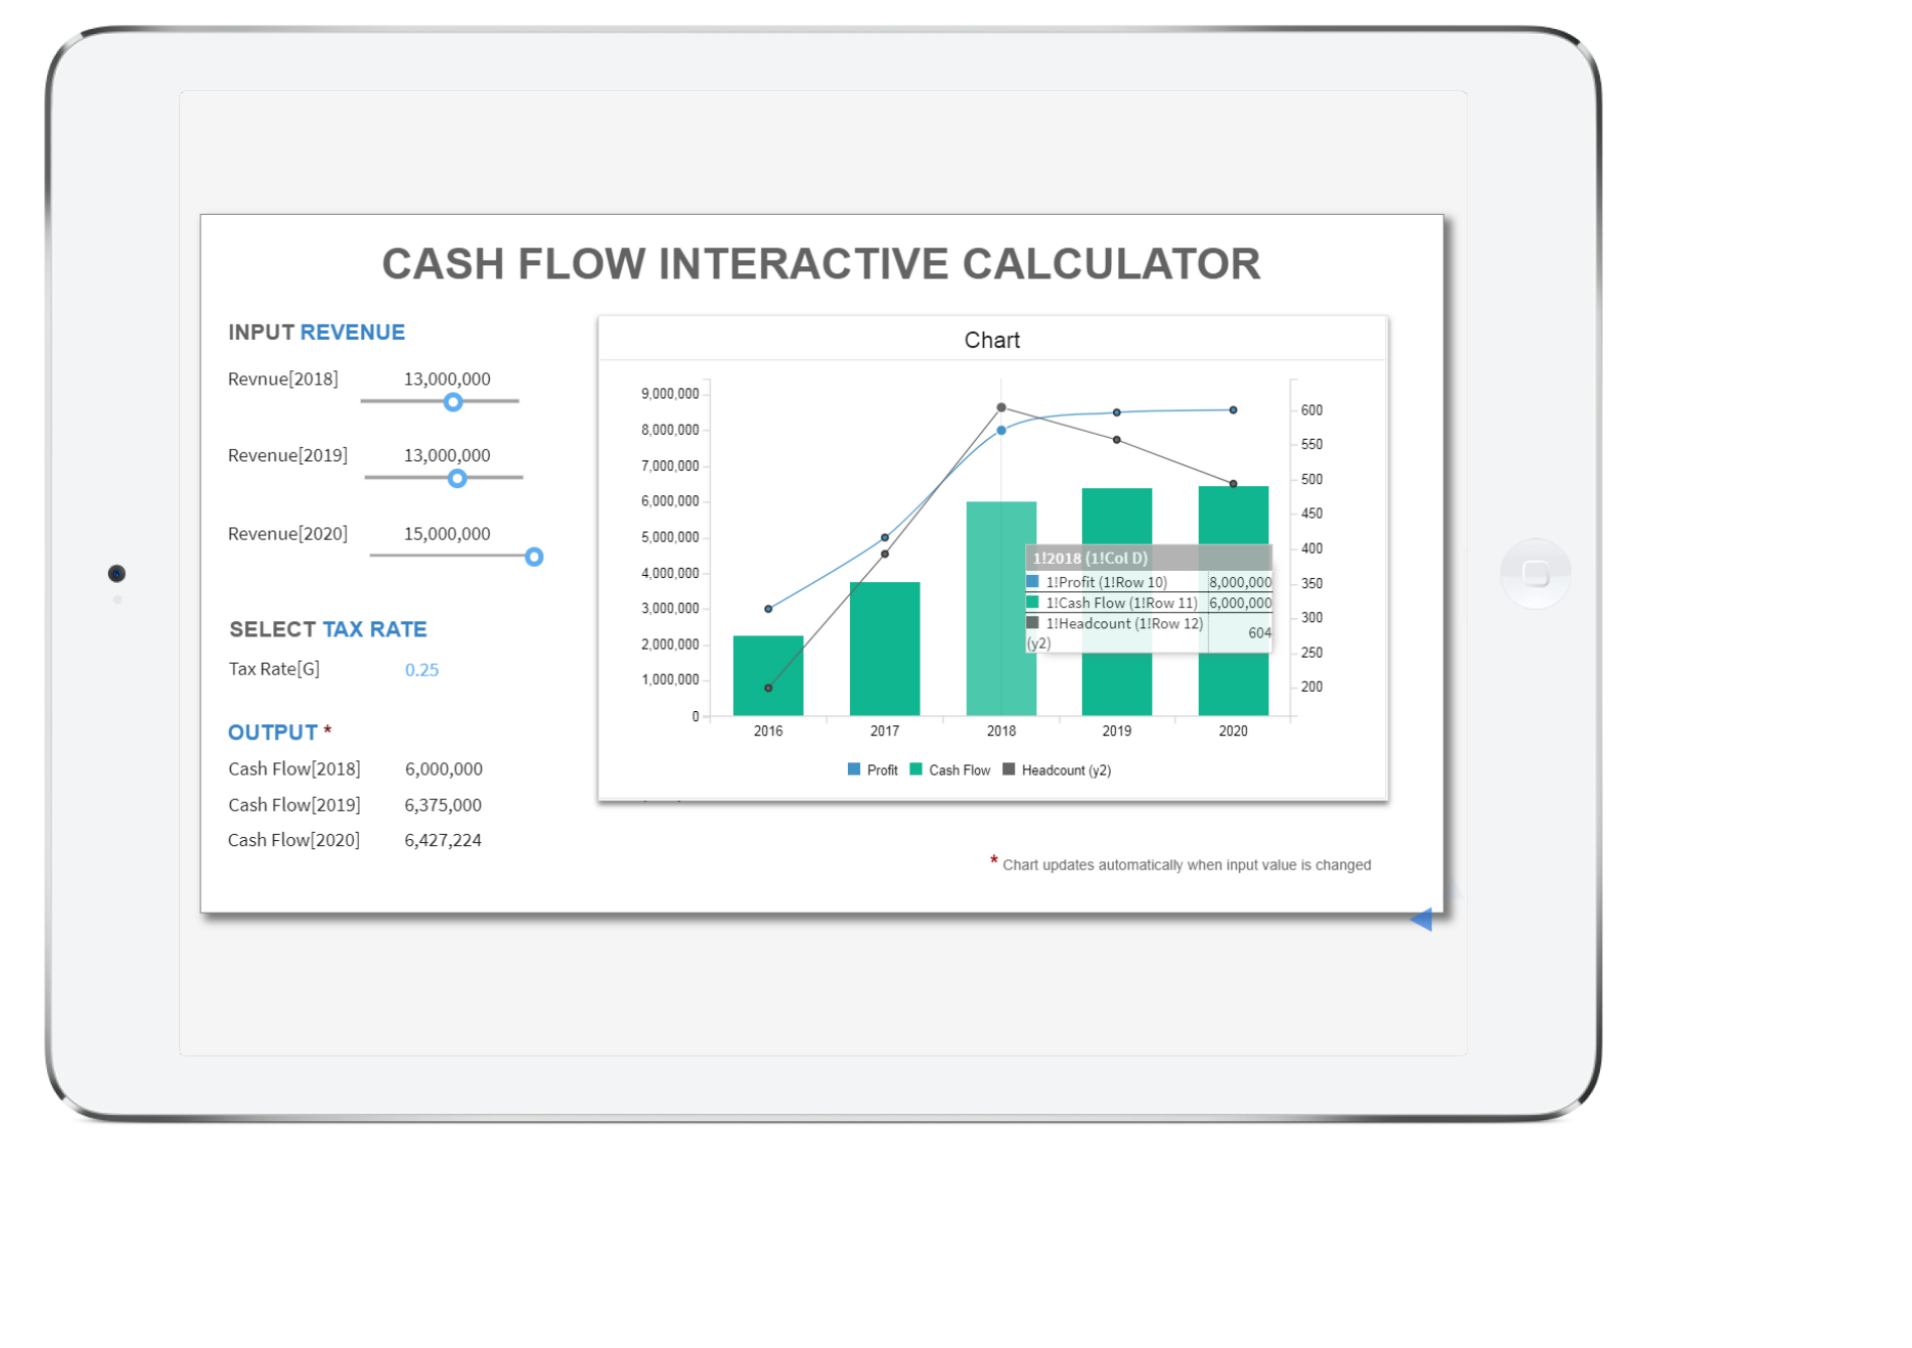
- In addition, he can now prepare interactive slides with input elements like drop-down boxes or sliders where he can specify different scenarios. Once a specific scenario is selected, charts and cells are automatically updated. This way, by sharing interactive slides (and not the spreadsheet), he can let his colleagues check how different numbers can impact the result without risking having unwanted changes in the model or exposing the inner workings of the model (unnecessarily complicated for most of the spreadsheet users let alone, at times, confidential).
Try Visyond without signing up
See interactive demoFeatured Case Studies

Get started today
- Leverage Excel skills
- Do in minutes what takes days for others
- Be productive, insightful and in control