
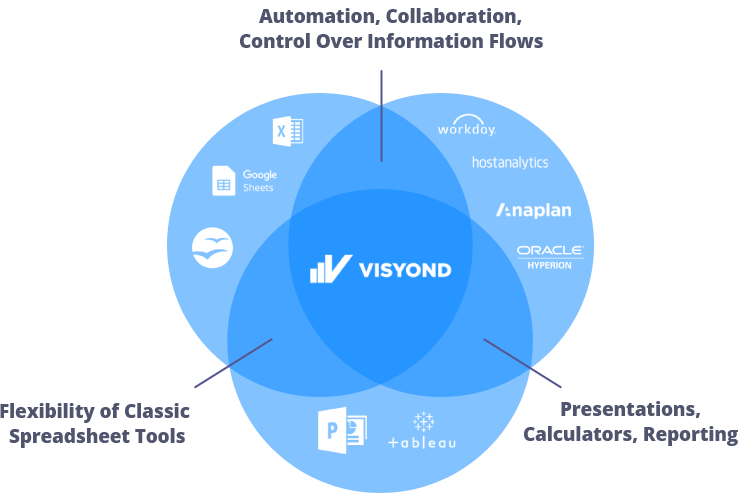
What is Visyond?


What Does Visyond Solve?
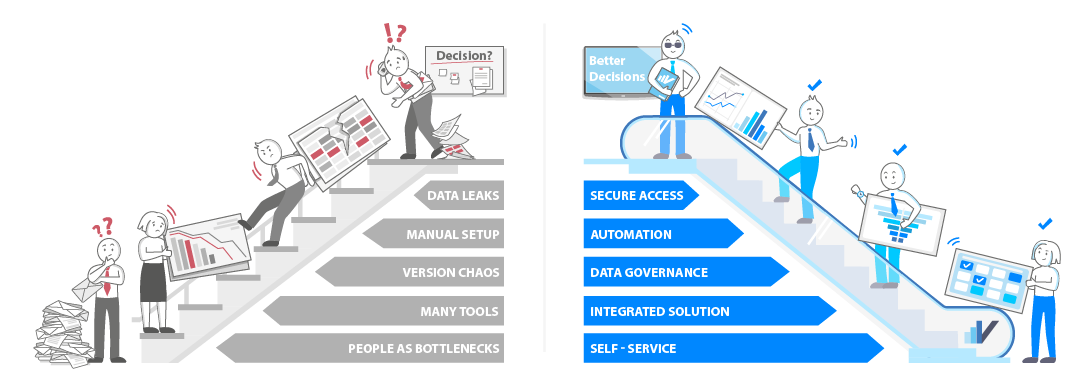
Analysts, experts, clients, and CxOs must collaborate with strict requirements on data security and governance.
Without Visyond, the process requires multiple platforms and causes numerous problems.
Enter Visyond
You will be in full control of all the steps of your workflow: from spreadsheet modeling and auditing, data gathering, forecasting and scenario planning, to the presentation of interactive dashboards, financial statements and reports.

Security and IP Protection
Collaborators view or edit only selected parts of projects without being exposed to unnecessary details or sensitive information.

Data Governance
Single source of truth is established by tracking inputs, history of changes, scenarios, sensitivities, simulations, conversations, and supporting documentation in a single place that tells a story where nobody can overwrite other’s work.

Flexibility
Analyses, presentations and calculators, dashboards, financial statements and KPI reports are dynamically driven by spreadsheets, built and shared in minutes without experts or moving data across tools.

Error Reduction
Risk of errors is reduced with automated ‘What-If’ analysis and Financial Statements.
-
 Save up to 80% of time on routine tasks
 -
 Reduce average cost by $420 per employee/month
 -
 Significantly reduce errors
So Why Visyond?

Secure and Granular Sharing of a Single Source of Truth
- Secure data by sharing only specific worksheets, dashboards and reports each collaborator needs to interact with
- Track all changes, comments, supporting documents and information in one place
- Increase transparency, improve governance, accountability, and knowledge management

Collaborative Automated Real-time 'What-if' Analysis
- Automate analytical tasks and stress-testing, and do in minutes what takes you days now
- Empower collaborators to contribute analyses in one document, not their version
- Create data visualization in the same place where you carry out calculations
- Create spreadsheet-driven presentations, calculators, financial statements and KPI reports

Minimal Learning Curve and Compatibility with Excel
- Keep your work habits & leverage Excel skills in a familiar environment
- Understand model structure, detect errors and anomalies
- Automate and standardize your business-case workflows
- Custom workflows, integrations and on-premise installation are available
Flexible. Familiar. Scalable.
Request DemoVisyond is for...
-
FUNCTION
-
 Analysts and Modelers
 -
 CxOs & Decision Makers
 -
 Sales & Communication
 -
 Consultants
 -
-
-
USE CASE
-
 Risk Management
 -
 Planning & Modelling
 -
 Budgeting & Forecasting
 -
 Financial Reporting
 -
 Investment Analysis
 -
 Scenario Analysis
-
-
INDUSTRY
-
 Banking
 -
 Management Consulting
 -
 Financial Services
 -
 Telecommunication
 -
 Real Estate
 -
 Insurance
-
Benefits
Full Transparency and Data Governance
Always know who contributed what, when and why
Secure Collaborative Environment
Manage access and share projects fully or partially
Data Analysis in Minutes
Automate routine analytical tasks and their setup without experts

Testing Assumptions in Real Time
Quickly get insights from your data through interactive presentations

Streamlined Communications
Have a single source of truth for your data & documentation

Automated Financial Statements
Easily generate financial statements and KPI reports
Familiar Excel-Compatible Experience
Start getting value immediately by importing your Excel file

Cloud-based Global Accessibility
Access at any time, from any place, using any device
Reduction of Errors
Audit spreadsheets and explore your models
How We Compare to Others?
analysis tools and BI / data visualization solutions.

|
SPREADSHEETS + ADDONS | COLLABORATIVE SPREADSHEETS | FILE SHARING TOOLS | DATA VISUALIZATION | FINANCIAL APPS | |
| Spreadsheet, debug and audit | ||||||
| Selective sharing and workflows on a single source of truth | ||||||
| Collaborative what-if analysis in real time | ||||||
| Spreadsheet driven interactive presentations and reports | ||||||
| Cost / Value |